The prevalent trend in the cryptocurrency space has had a more pronounced effect on the Ripple market performance. XRP is currently retracing lower resistance, and it isn’t likely that we’ll see an uptrend in this market very soon.
XRP’s Forecast Statistics Data:
XRP’s current price: is $0.3287
XRP’s market capitalization: $16.47 billion
XRP’s Circulating supply: 49.65 billion
XRP’s Total supply: 99.99 billion
XRP’s Coinmarketcap ranking: #7
Nevertheless, we must describe how the best approach which can be given to this kind of market. And that will shall do in this analysis. We will examine signs coming off trading indicators, and we’ll use them to forecast price action that we may soon experience.
Key Price Marks:
Resistance levels: $0.3350, $0.3400, $0.3500
Support levels: $0.3340, $0.3310, $0.3287

Selling Pressure Pushes Ripples Price Lower, but Tamadoge Promises a Bullish Market
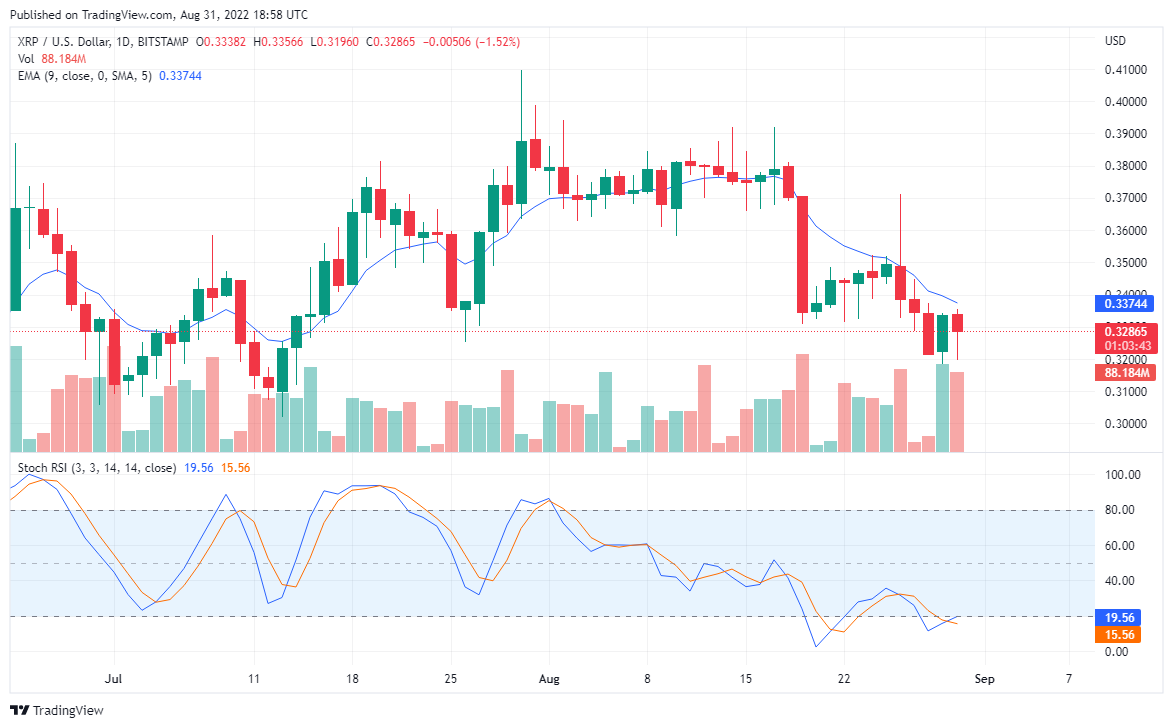
XRP/USD daily chart reveals that after buyers had mounted a resistance near $0.3200, which gave price movement an upward correction. Some market participants quickly sell their crypto holdings, and this subsequently plunged the price to lower support. However, perhaps the support created by buyers near $0.3200 will be strong enough to resist further testing. Eventually, if it is strong enough, this will cause price action to consolidate in the meantime.
This conclusion can be drawn from the display on the Stochastic RSI indicator. We can perceive that the lines of this Indicator have crossed each other in the oversold region, however, these lines aren’t facing any direction. And in this case, we might want to conclude that Ripple price action may range due to lack of direction.

XRP Price Analysis: XRP/BTC Shows a Fairer Market Performance
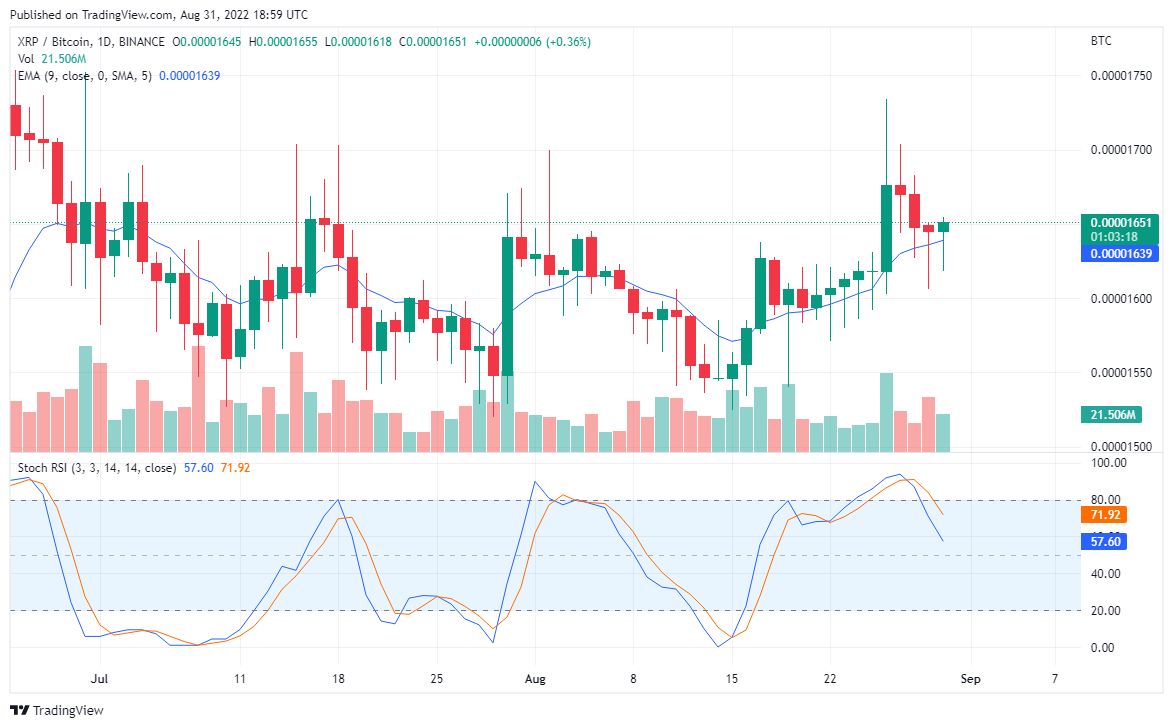
Applied trading indicators on the XRP/BTC are portraying a kind of divergence. However, this may be because one of the two indicators here is a lagging one. Be that as it may, the most important thing to note is that this market shows a better performance compared to the XRP/USD market. The latest candlestick here is a hammer candlestick, and this may be indicating that higher resistance may be reached in this market. Also, the Exponential Moving Average curve lies under the value activity.
Your capital is at risk
Consequently, this increases the hope of further value increase. Nevertheless, it is important to consider the signs on the Stochastic RSI, which portrays a downward correction. Therefore it is important to anticipate the possibility of a downtrend. Consequently, traders entering this market should consider entering with a pending buy order around the 0.00001686 level. This will ensure that a bullish reversal has begun before one enters, since trading indicators are misaligned.
The newest Doge on the block, Tamadoge is coming out the gate barking, becoming one of the biggest hyped meme coins of all time and pushing the boundaries of the Play-to-Earn space, in order to provide a game that people will be climbing over each other to use.
Related
Tamadoge – Play to Earn Meme Coin
- Earn TAMA in Battles With Doge Pets
- Capped Supply of 2 Bn, Token Burn
- NFT-Based Metaverse Game
- Presale Live Now – tamadoge.io


